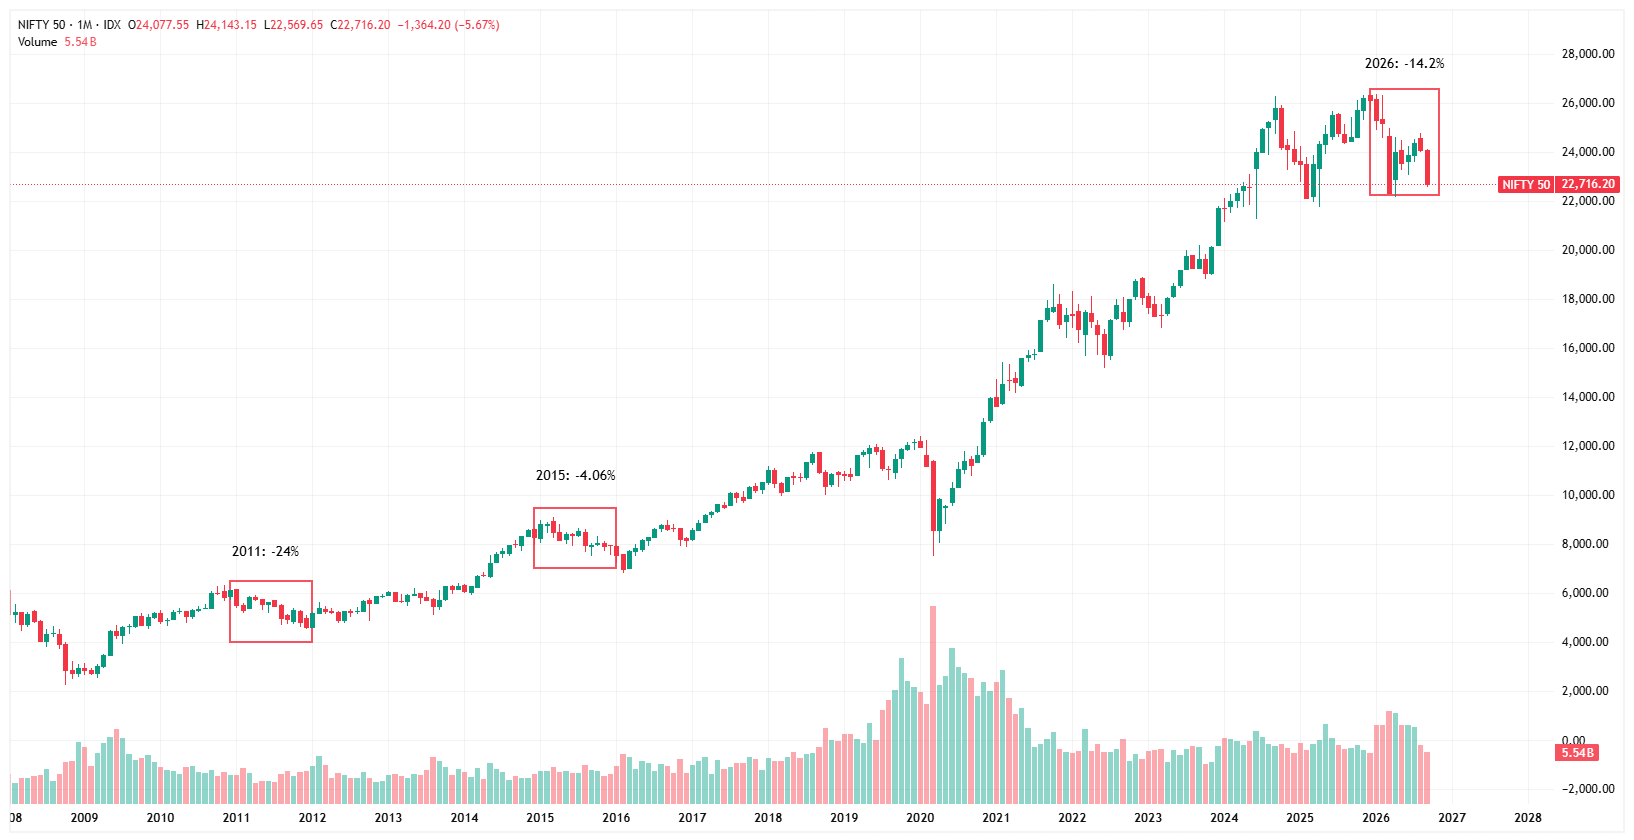
When I saw the market falling continuously this year, I started wondering, has this happened before, and what happened after the fall? So I went back through the Nifty 50’s annual returns, expecting to find a pattern. And one thing immediately caught my attention: the market has fallen before, and more often than not, the fall was followed by a strong recovery.
Anyone who invested through 2011 remembers the feeling of market bleeding. The market was falling, confidence was fading, and it felt like there was no clear bottom. The Nifty had lost nearly 24% that year. But ask the same investor what happened next, and the story changes completely.
Since 2011, the Nifty 50 has finished a year in the red only three times which are 2011, 2015 and now 2026. That’s just three down years in a period filled with wars, elections, pandemics, inflation and rate shocks. And interestingly, each major fall was followed by a recovery. 2011’s ~24% fall was followed by a ~28% gain in 2012. The smaller decline in 2015 was followed by positive years, including a nearly 29% gain in 2017.
The lesson isn’t that every fall guarantees a great next year. It’s that market declines have historically looked much bigger while you’re living through them than they do when you look back at the chart.
Now it’s 2026. The Nifty is down around 14%, after having been near 26,000 and falling towards 22,700. For someone who started investing in the last few years, this might be the first time the market has genuinely tested their conviction. And that’s what makes this chart interesting.
The red years look terrifying up close. From a distance, they look like dents in a much longer climb. History doesn’t promise what happens next.
But it does leave us with a better question than “How much lower can it go?” ,
“What happens when the fear eventually fades?”