Hi stratzy team,
So I was going through different combinations of algos to check which offer the best drawdown and return combination when I came across this.
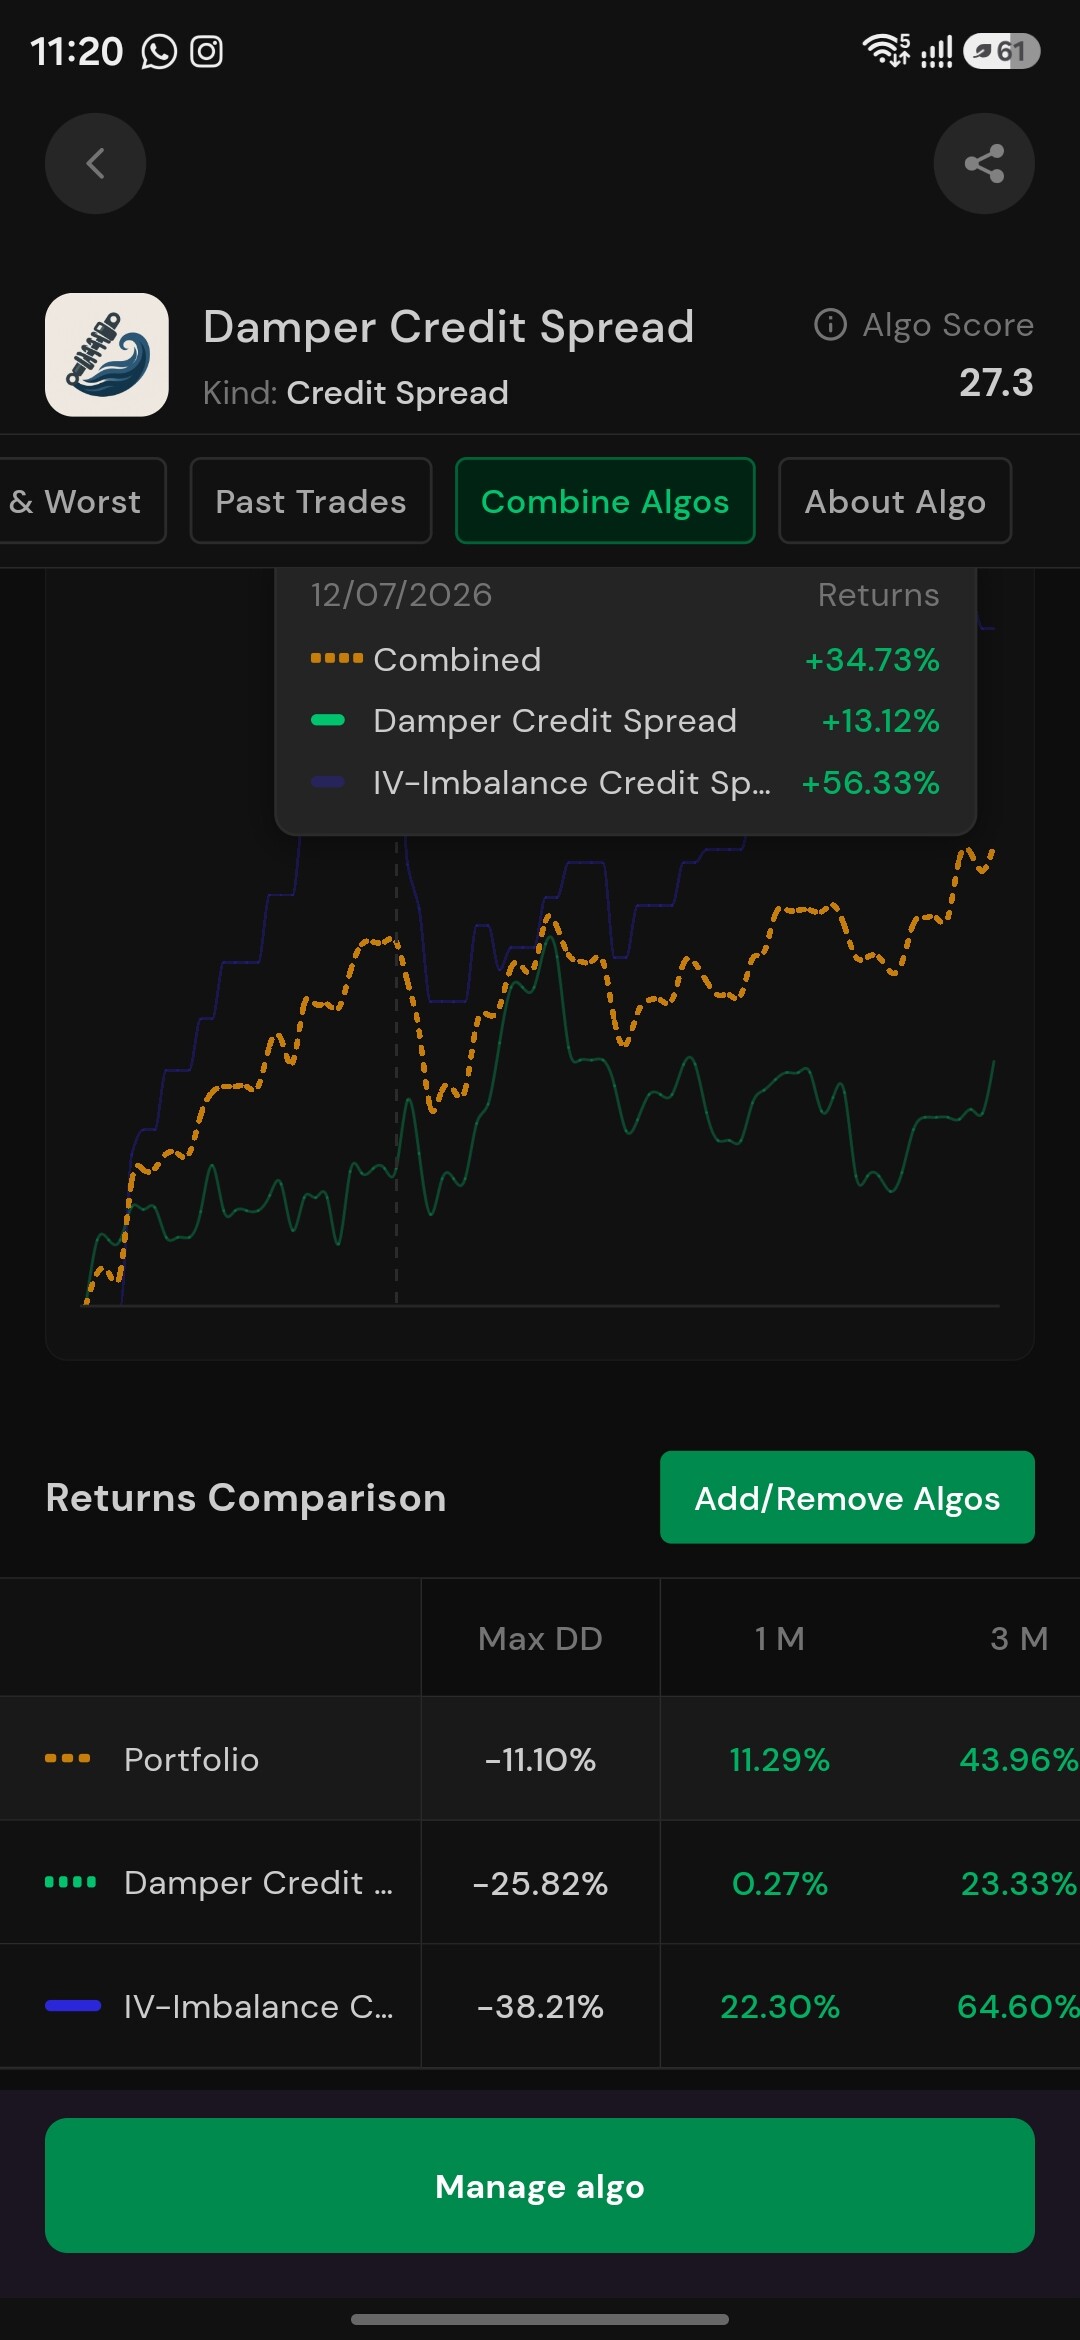
This first image shows the current combined percent is 34.73% on 12/7/2026
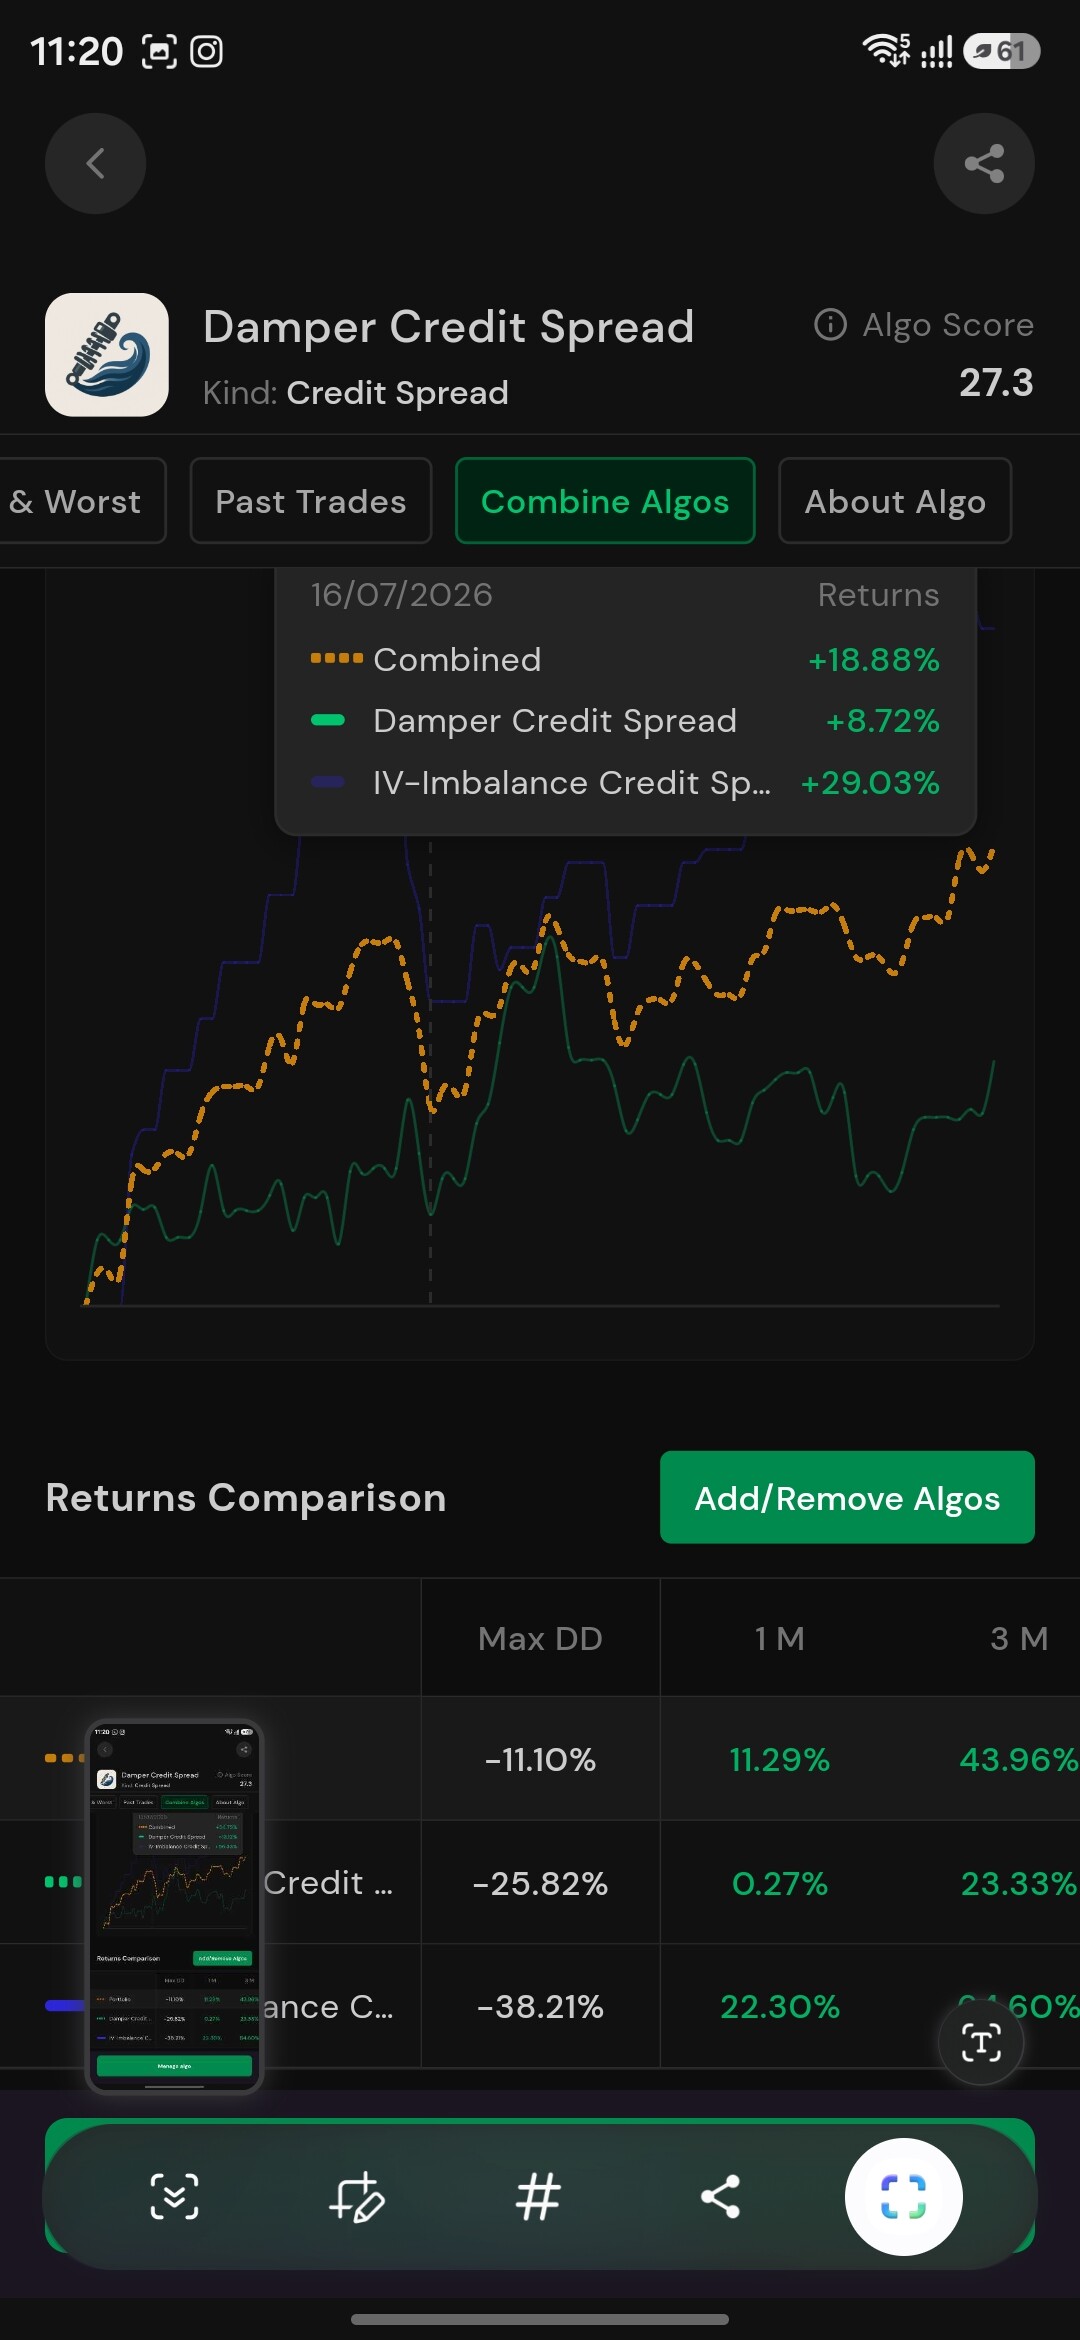
And this second image shows its 18.88% for the combination on 16/7/2026 which is 4 days after the first screenshot
This makes the draw down around 15%. And below for the combination it shows max drawdown as 11.10%.
The calculations somewhere seem to be incorrect.
Hi @urvikgala
Happy to clarify this. The performance and drawdown data displayed on Stratzy are calculated from the underlying equity curves and are intended to reflect the Algo/combined portfolio performance transparently and accurately.
One important point regarding the screenshots: Max Drawdown cannot be calculated simply by subtracting two displayed cumulative return percentages. For example, moving from 34.73% to 18.88% is a 15.85 percentage-point difference, but drawdown is calculated as the decline in the equity value from its previous peak:
Drawdown = (Current Equity ÷ Peak Equity) − 1
So, a portfolio at +34.73% has an equity value of 1.3473, while at +18.88% it is 1.1888. The drawdown is therefore measured relative to the 1.3473 peak, rather than as 34.73 − 18.88.
Also, the purpose of combining Algos is precisely to look at their portfolio behaviour rather than evaluating each equity curve in isolation. As you can see in the screenshots, the individual Algos have different return paths; periods where one is performing strongly can overlap with periods where another is experiencing a drawdown or moving sideways. When combined, these movements can offset each other and produce a smoother overall equity curve with a potentially lower drawdown profile.
This is also why the combined portfolio should be evaluated using its own equity curve and metrics.
I hope this helps clarify how the combined performance and Max Drawdown figures are being represented.
1 Like