Every time you charge your phone, take some transport or even when a building goes up, some of India’s core industries did their job. Most of us never think about it on a day to day basis but the power they hold to disrupt everything is beyond imagination. Every month one number is released to indicate us how well these industries performed.
The Index indicating the strength of these sectors is called Index of Core Industries (ICI), and it measure the Infrastructure output.
What is Infrastructure Output?
Infrastructure output measures the combined production growth of a country’s key core industries that build and support the broader economy.
In India, infrastructure output refers to a combined index that measures the performance of 9 Core Industries: Electricity generation (30.9%), Refinery production (23%),Steel production (17.6%), Crude oil production (7.4%), Coal production (5.6%), Iron ore (4.9%), Cement production (4.4%), Natural gas production (3.8%) and Fertilizers production (2.7%).
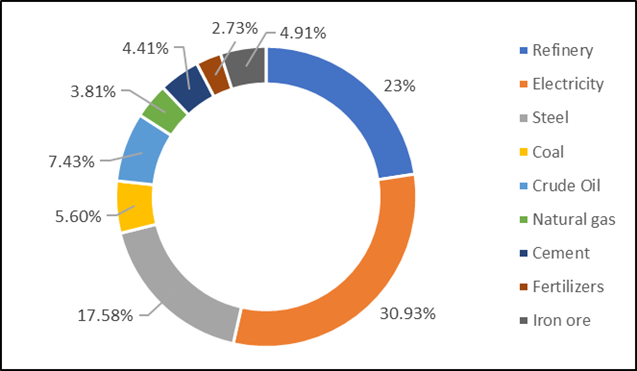
Source: Office of the Economic Adviser (OEA)
Why is ICI important?
ICI tracks the combined output of eight (now nine, after Iron Ore was recently added) infrastructure and heavy-industry sectors that together form the backbone of the Indian economy. These aren’t just any industries; they collectively make up over 40% of the weight in the broader Index of Industrial Production (IIP).
ICI matters because these core sectors are the raw inputs and infrastructure that every other part of the economy depends on. You can’t build, manufacture, transport, or power anything without steel, cement, electricity, and fuel. So when ICI is rising steadily, it’s a strong signal that the other parts of the economy is growing too, which in turn suggests healthier GDP growth, job creation, and investment activity down the line.
August Snapshot
India’s Infrastructure output across eight core infrastructure sectors grew 4.8% year-on-year in August, compared with August 2025. This is slightly less than the growth rate of 5.0% recorded in July 2026.
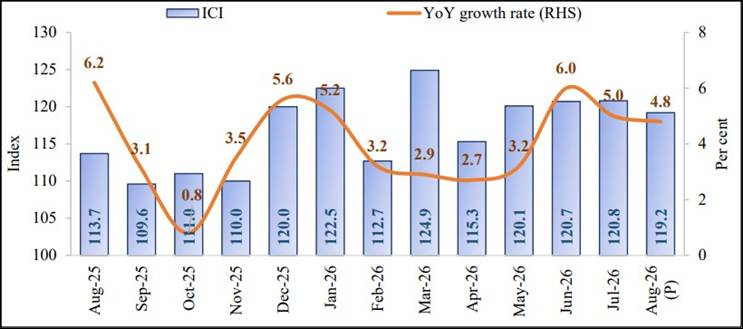
Source: Office of the Economic Adviser (OEA)
The above chart shows the ICI levels and YoY growth rate. We can see that the overall production is increasing, starting from 113 in August 2025 to 119 in August 2026. But the pace at which the growth is happening is unstable or rather bumpy. March 2026 saw a good output of almost 125.
So, the bigger picture here is, things are generally getting better, not worse.
Who led the growth?
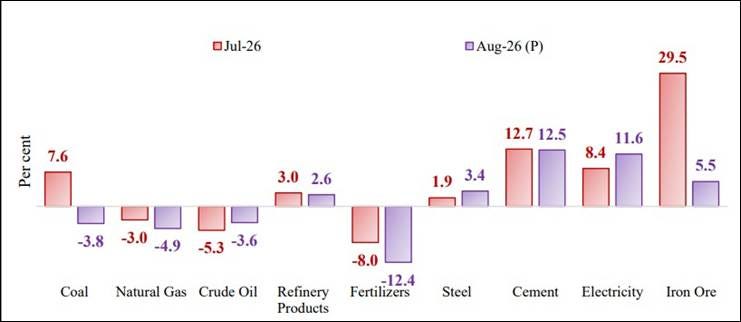
Source: Office of the Economic Adviser
The growth in index was led by cement which expanded by 12.5%, followed by electricity at 11.4% and iron ore at 5.5%. Steel and refinery products grew 3.4% and 2.6% respectively. Fertilizers, Natural Gas, Coal and Crude oil declined by -12.4%, -4.9%, -3.8% and -3.6% respectively.
Why does it matter to us?
For us, this index quietly shapes things you feel in daily life without realizing it’s connected. When core industries like steel, cement, and electricity are growing well, it usually means more construction, more factories running and generally a stronger economy which over time can mean better growth, more job security, and more stability in prices for things like fuel and power.
When these industries slow down or decline, it often shows up later as slower job creation, weaker income growth, or price pressures, especially in things tied to energy and fuel costs.
For a retail investor specifically, this number is like an early weather report for the economy. Stocks in sectors like cement, steel, power, and infrastructure tend to do well when this index is trending up consistently, because it means real demand is picking up in those businesses, not just optimism, but actual production numbers.
It also gives us an indication of how the key sectors hold during different situations. So as an Investor and a citizen of India, we must be aware of how these core industries in our countries are performing.
Growth is happening, quietly, one core industry at a time. The question now is, are you watching it, or waiting to be told about it?