2008. 2014. 2020.
Three very different years. Three major global events. And one interesting similarity: Nifty’s relative position versus the global stock market was at levels similar to where it stands today.
Now, in 2026, the same setup is appearing again. Is this just another phase of under performance? Or are we approaching another important turning point for Indian equities?
We looked at Nifty 50 vs MSCI ACWI (All Country World Index) in a common currency, US dollars to understand where India stands relative to the rest of the world. And the analysis raises a much bigger question, Could 2026 become another turning point for Nifty versus the world?
What will you find in our analysis?
-
Why Nifty’s relative performance versus the world is at a historically important level similar to 2008, 2014 and 2020.
-
Why India’s recent under performance isn’t just about Nifty falling and how valuations, global markets, the AI rally and the rupee have all played a role.
-
What could determine India’s next phase
Nifty vs The World: What Does the Chart Tell Us?
To understand India’s position, we compared the Nifty 50 with the MSCI ACWI (All Country World Index). ACWI represents equity markets across developed and emerging countries, giving us a broad view of how Indian equities have performed compared with the global stock market. We have converted both indices into US dollars.
Why does that matter?
Because when you look at Nifty in dollars, you are not only measuring how Indian stocks performed. You are also capturing the impact of rupee depreciation against the dollar. So this chart answers a slightly different question: How has Indian equity wealth performed for a dollar-based investor compared with the global market?
`Nifty/ACWI (in dollars)`
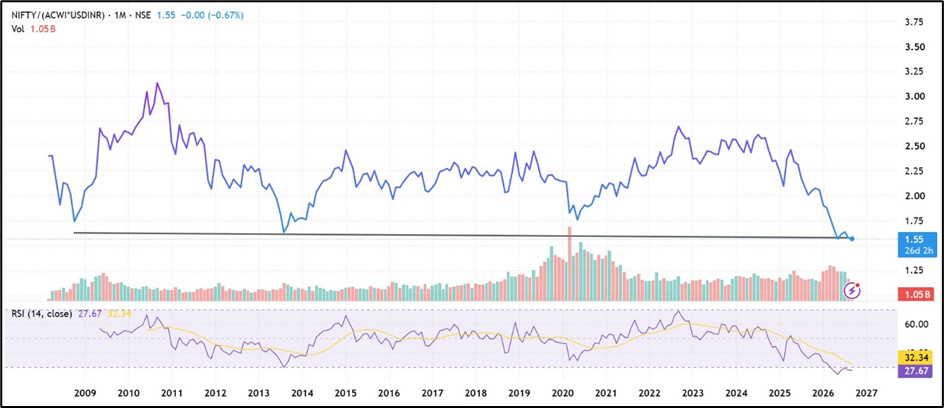
And this is where things get interesting.
We’ve Seen This Level Before - The current relative level of Nifty vs ACWI is not something we see very often. Historically, similar levels appeared around: Global Financial Crisis in 2008, 2014 Taper Tantrum in 2014 and COVID-19 in 2020.
These were all periods of significant uncertainty and major changes in global markets. And today, in 2026, we are once again seeing Nifty reach a similar relative zone. That doesn’t mean history will repeat itself. But when a market reaches a level that has previously coincided with major turning points, it is worth paying attention. So the obvious question is:
What Makes 2026 Different?
India is currently dealing with a combination of domestic and global challenges. Geopolitical tensions, trade uncertainty, foreign investor selling, higher crude prices and currency weakness have all created pressure on Indian equities.
The India-US Tariff dispute, where duties as high as 50% were imposed by US on certain sectors, tied partly to India’s continued purchase of Russian Oil. There has been a record Foreign outflows in the same period. FIIs pulled out more from the Indian equity market in the first half of 2026 then in the entire year of 2025. Tensions in West Asia also resulted in sharp increase in oil prices for India and increased the import cost as India imports majority of its crude oil requirements, worsened by the weaker rupee.
Several forces are working together. But Here’s the Part Most People Miss-
It is easy to look at the Nifty vs ACWI chart and conclude - “India has under performed.” That’s true. But the story becomes much more interesting when we look at what happened before this period of under performance.
From March 2020 to September 2024, Nifty significantly outperformed the global market. While Nifty generated an approximate returns of 210-220%, ACWI generated 120-130% in the same period. So, at the peak Nifty was beating the world by something close to 90%.
Nifty vs ACWI returns (2020-24)
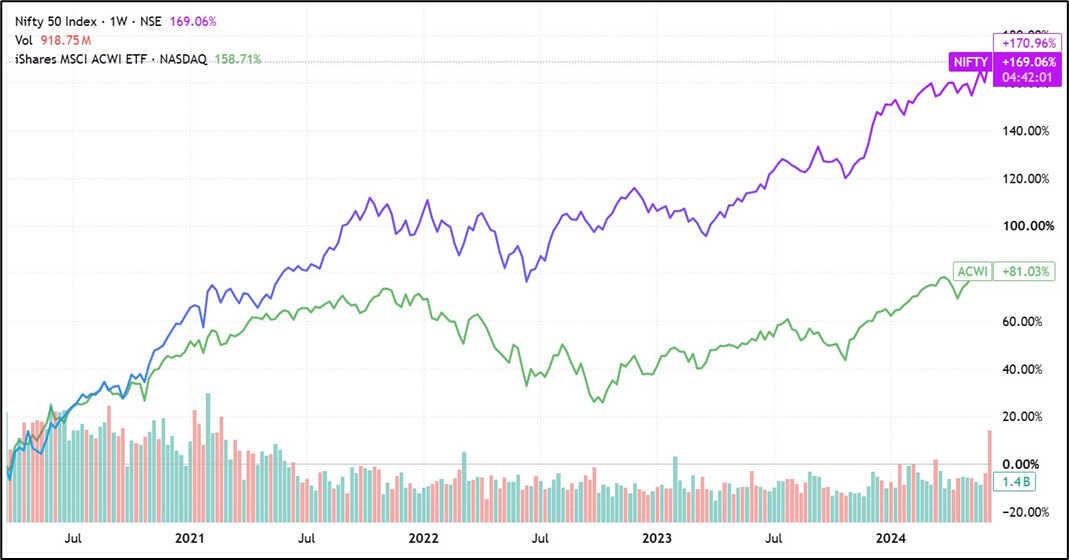
That’s a huge gap.
And when one market outperforms another by such a wide margin for several years, some degree of mean reversion should not come as a surprise. Nifty’s valuation multiple was well above its own long-run average by 2023-24 (~24x earnings vs. a historical median closer to 22x), riding an earnings growth rate that was never going to sustain. It doesn’t necessarily mean that Indian companies are fundamentally weak.
The World Got an AI Boost. While India was going through a valuation reset, global markets received a powerful boost from the AI boom. A significant portion of ACWI’s gains since 2024 has come from a relatively concentrated group of US mega-cap technology companies benefiting from the rapid growth of artificial intelligence. That has lifted the global benchmark significantly.
There is another important factor hiding inside the chart; Currency. The rupee has weakened against the US dollar over the past two decades. For an Indian investor, a stock can generate strong returns in rupees. But when those returns are converted into dollars, the performance can look considerably lower.
So, Is India Losing Its Long-Term Story? Not necessarily.
India has been a strong long-term compounding story over the past 25 years. What we are seeing today could simply be another periodic phase of relative under performance after several years of exceptional out performance. Markets rarely move in a straight line. Periods of strong out performance are often followed by periods where valuations cool, expectations reset and other markets catch up.
What Could Decide the Next Move?
The Nifty vs ACWI chart tells us where we are. But it doesn’t tell us where we are going next. That will depend on several factors like corporate earnings, valuations, currency, global markets, domestic policy, etc. These factors could determine whether India begins another period of out performance or whether the relative weakness continues for longer.
The Bigger Picture
The most interesting part of this analysis isn’t trying to predict whether Nifty will rise or fall tomorrow. It is understanding where India stands in the global market cycle. For us, the key takeaway isn’t simply to predict what happens next. It is to understand where we are, why we are here, and what could change the picture from here. The setup is worth watching. The next move will depend on what happens beyond the chart.