Statically, what is the stop loss of credit spread strategies in terms of net premium collected. This information will help us to decide correct position size.
Hi @nijinwilson
The profit target and stop-loss for our Credit Spread Algos are not based on a fixed multiple of the net premium collected. They are determined dynamically based on the risk associated with each trade, which is evaluated using the Algo’s predefined logic and criteria.
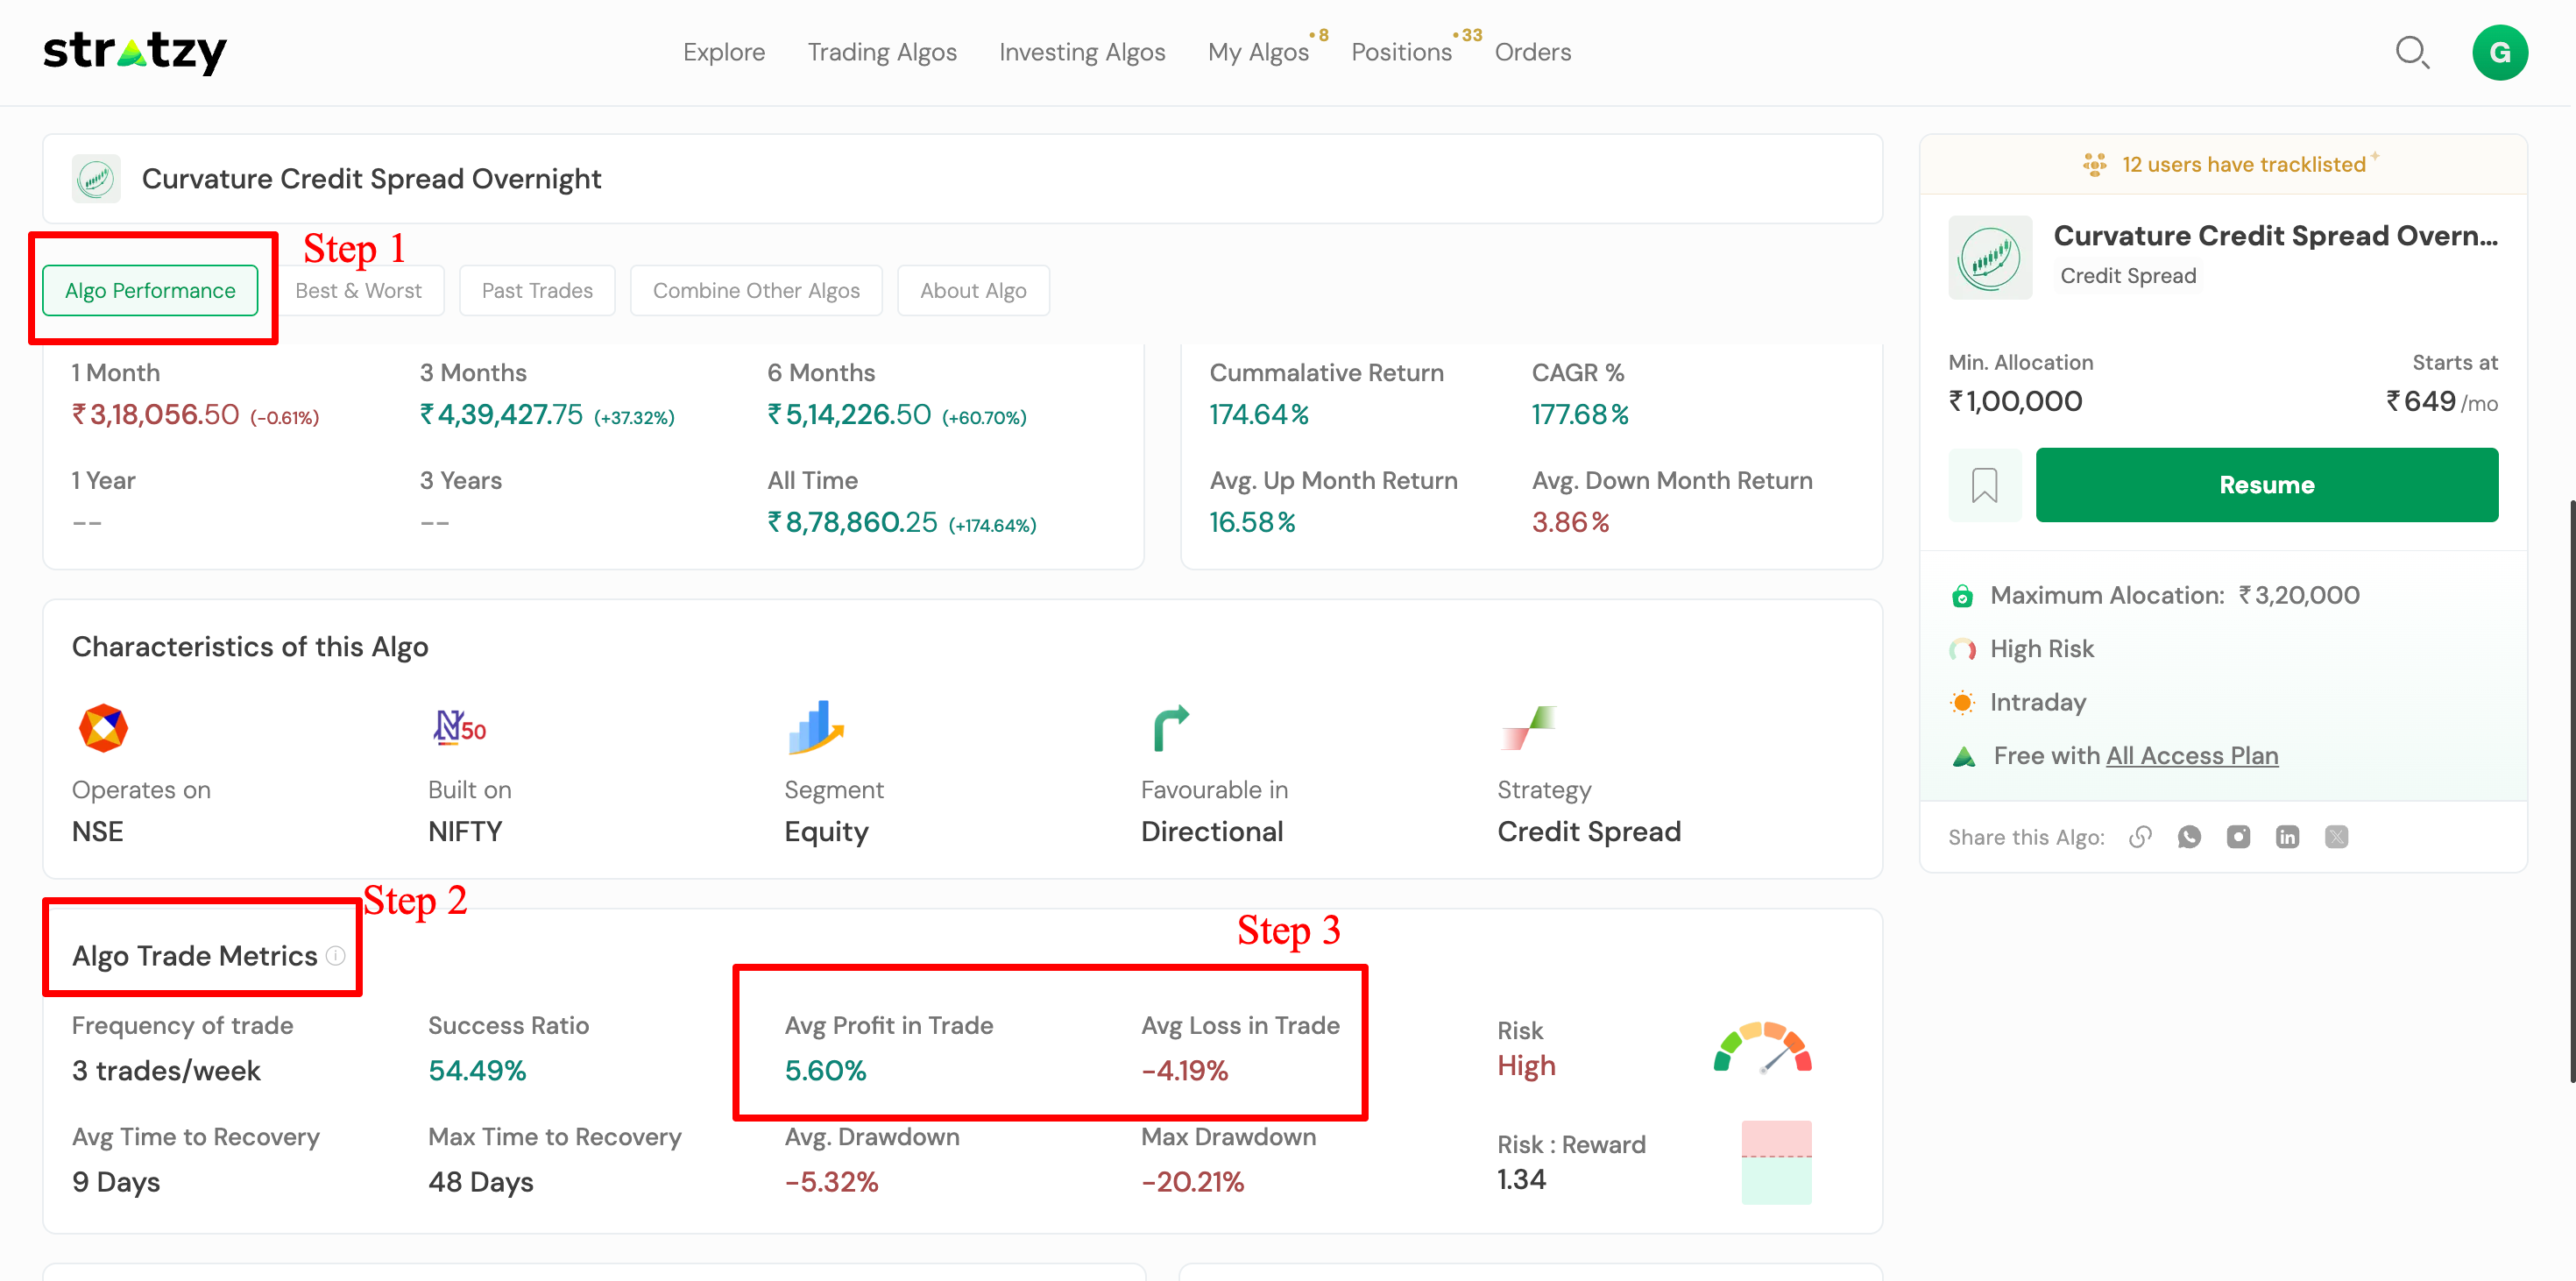
If you’re looking to understand the typical profit and loss characteristics of an Algo, I would request that you refer to the Algo Trade Metrics available under the Performance section.
In particular:
-
Average Profit in Trade represents the average profit across all profitable trades.
-
Average Loss in Trade represents the average loss across all losing trades.
These metrics provide a much better representation of the Algo’s historical trade behaviour than a single static stop-loss value.
Please refer to the screenshot below for the steps to locate these metrics.
1 Like
The returns showing in the image are not calculating in a proper way. You should show the returns as per allocated capital . Please update those numbers properly so that common people understand better, otherwise its confusing.
Hi @Avinash
Thank you for your feedback.
I would like to clarify that the performance metrics shown on the platform are accurate and completely transparent. They are calculated based on the maximum allowed capital allocation for each Algo, respectively, and not on the capital allocated by an individual user.
This provides a standardized way of comparing the historical performance of Algos, irrespective of the amount invested by different users.
If you need any further clarification, feel free to write to us at support@stratzy.in, and I’ll be happy to assist you.
1 Like
I didnt mean that.
Suppose 1 month return is showing as 3,18,056 rupees but the percentage showing as -0.61%.how can a common user understand this ? Is this algo generated a 3.18 lakh profit which is 100 % return in 1 month ? I hope you undertand my point now.
Hi @Avinash
Thank you for writing back and clarifying your query. I now understand the point you were trying to highlight.
I would like to mention that we have clearly indicated at the very top of every Algo page that the performance displayed is on a Cumulative Performance basis (Max Allocation of the Algo).
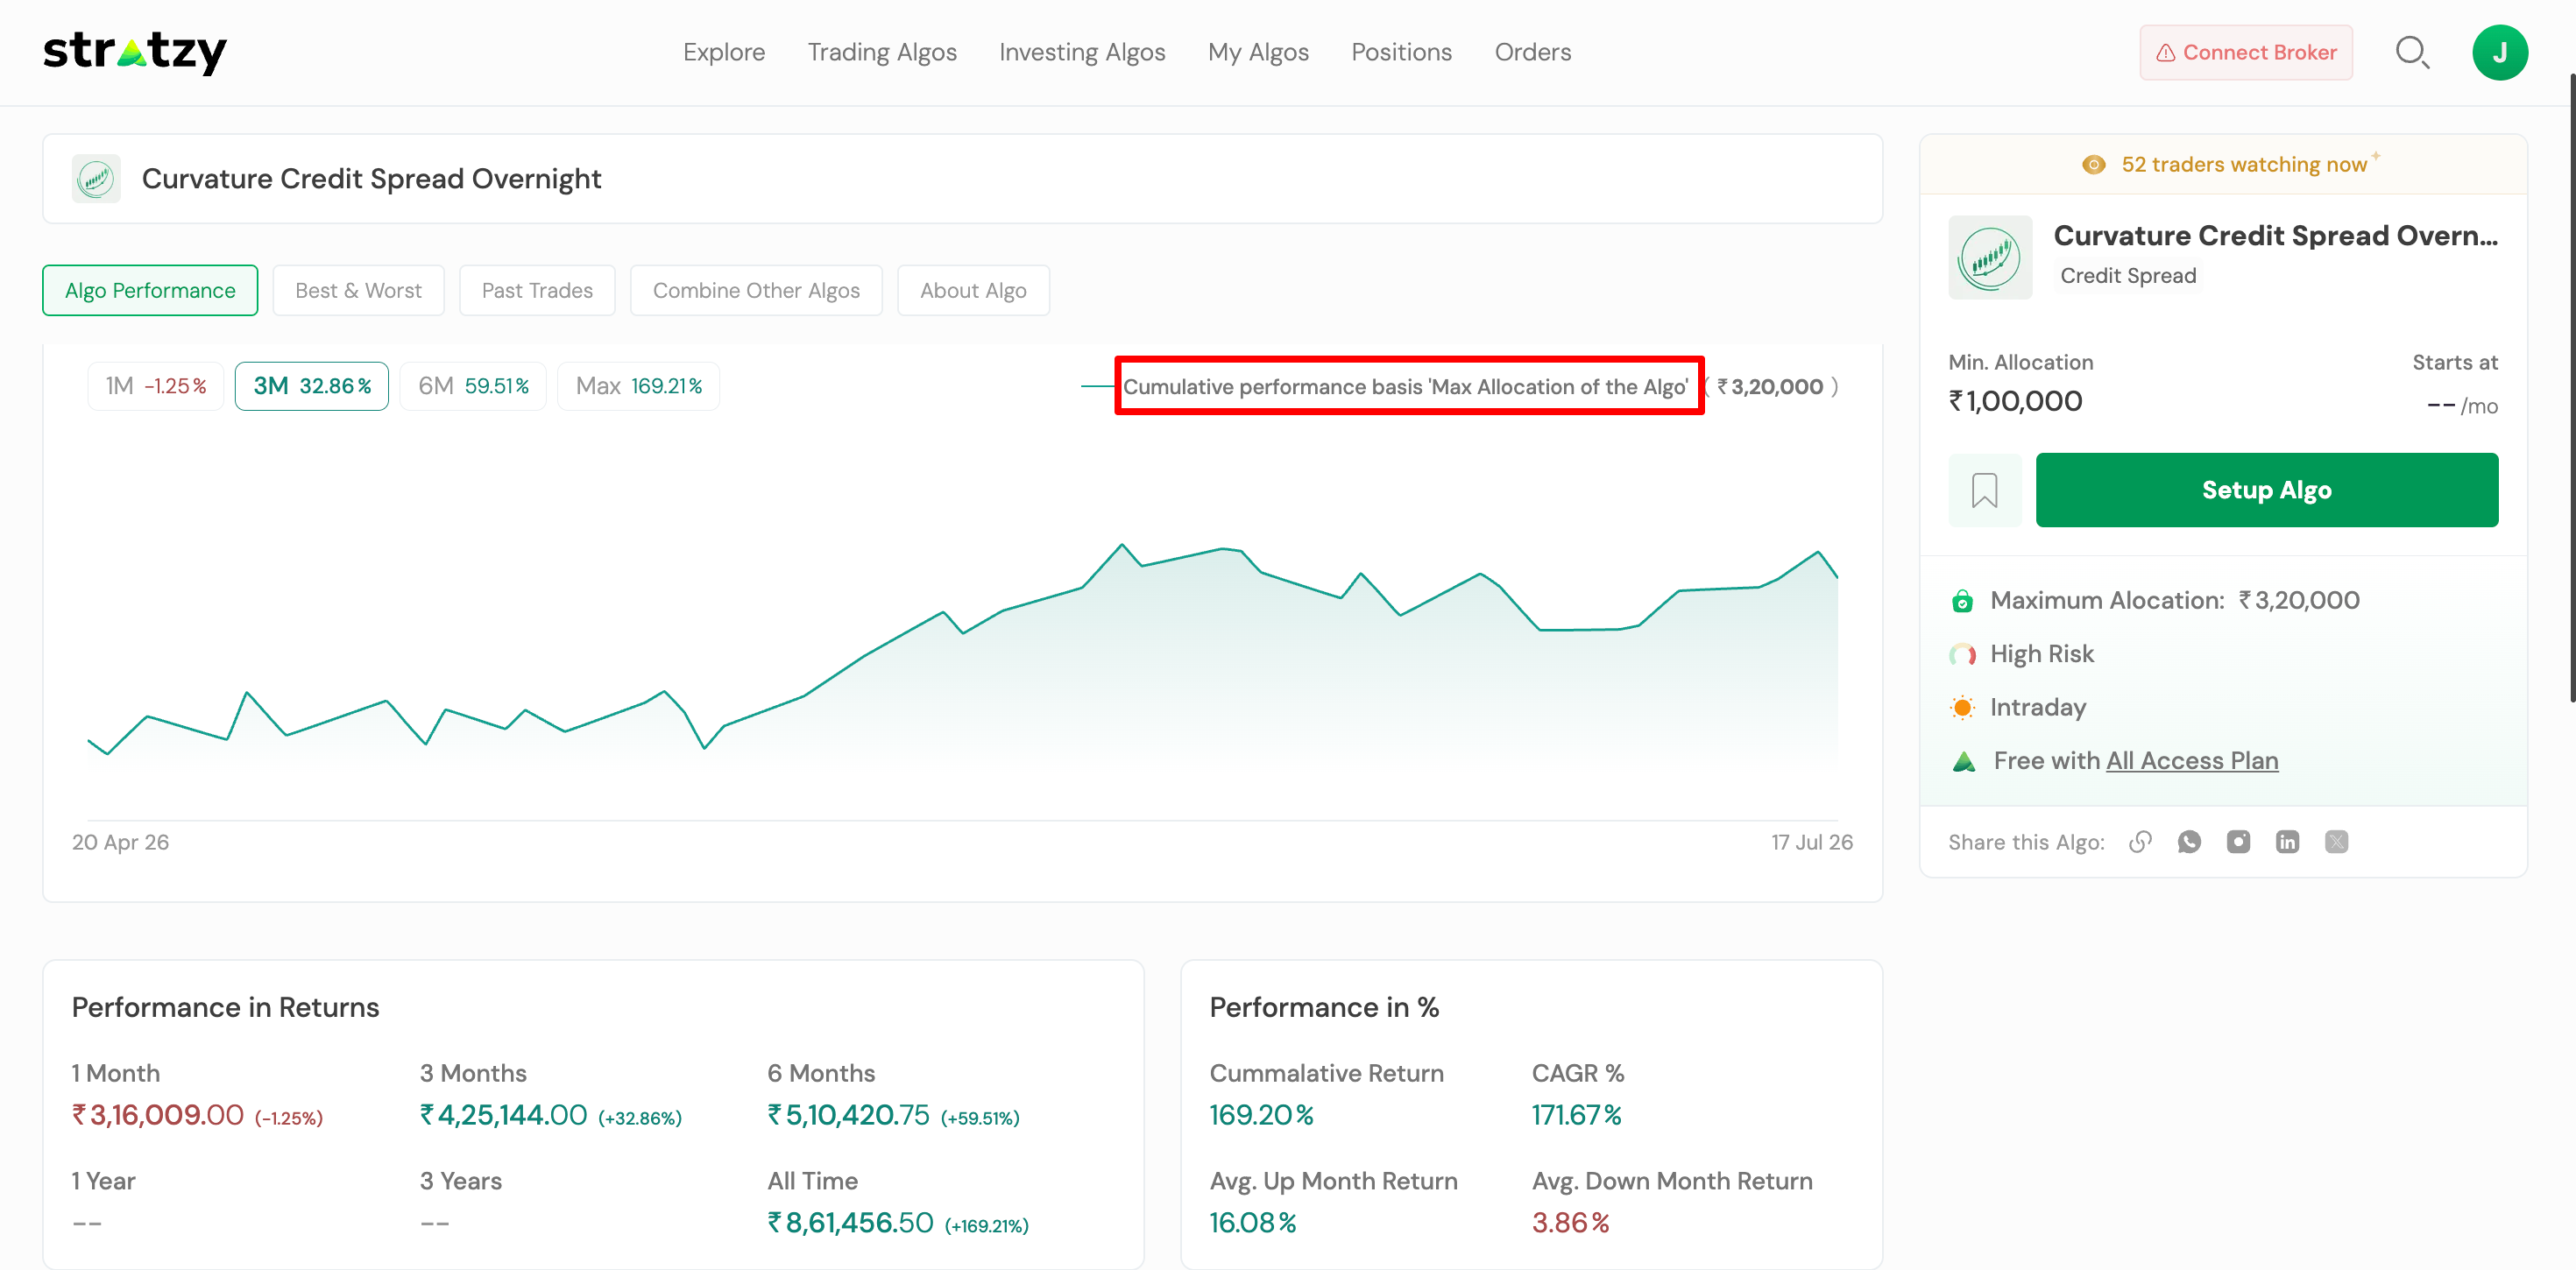
To explain the screenshot you referred to:
- The 1 Month Return for the Algo is -0.61%.
- The Maximum Capital Allocation for this Algo is ₹3.2 Lakhs.
- Therefore, applying a return of -0.61% on the maximum allocation results in a portfolio value of approximately ₹3,18,056.50 (i.e., the base capital after accounting for the month’s performance).
So, the figure displayed is not the profit generated during the month. It represents the current portfolio value (Base Capital ± Profit/Loss) based on the cumulative return over the selected period.
That said, we completely understand how this presentation can be confusing at first glance.
To make this clearer, in our upcoming updates, we are adding (Basis Max Allocation) alongside the “Performance in Returns” section. We have also noted your feedback and will continue working towards presenting these metrics in an even simpler and more intuitive manner going forward.
Thank you once again for taking the time to share your observation. Feedback like yours helps us improve the platform for everyone.
1 Like
Thank you for understanding my point finally. One more thing is Algo score is not showing for all the algos, please maku sure to show them in the next update.
1 Like