When comparing investment strategies, higher returns almost always grab our attention.
A strategy delivering 25% CAGR naturally seems more attractive than one delivering 18%.
But what if achieving those higher returns meant experiencing a 40% drawdown along the way?
Would it still be the better investment?
This is where risk management becomes just as important as return generation.
The Hidden Cost of Drawdowns
Consider two hypothetical investing strategies:
| Metric | Strategy A | Strategy B |
|---|---|---|
| CAGR | 25% | 18% |
| Maximum Drawdown | 40% | 15% |
| Ending Wealth After 5 Years (at stated CAGR, starting with ₹1 lakh) | ₹3.05 lakh | ₹2.29 lakh |
At first glance, Strategy A appears to be the obvious winner. Over five years, it would have generated approximately ₹76,000 more wealth on an initial investment of ₹1 lakh.
However, this comparison tells only part of the story.
While CAGR captures the annualized growth over the investment period, maximum drawdown measures the largest decline from a previous portfolio peak during that period.
Strategy A generates significantly higher returns, but it also experiences a much deeper drawdown.
And this is where things become interesting.
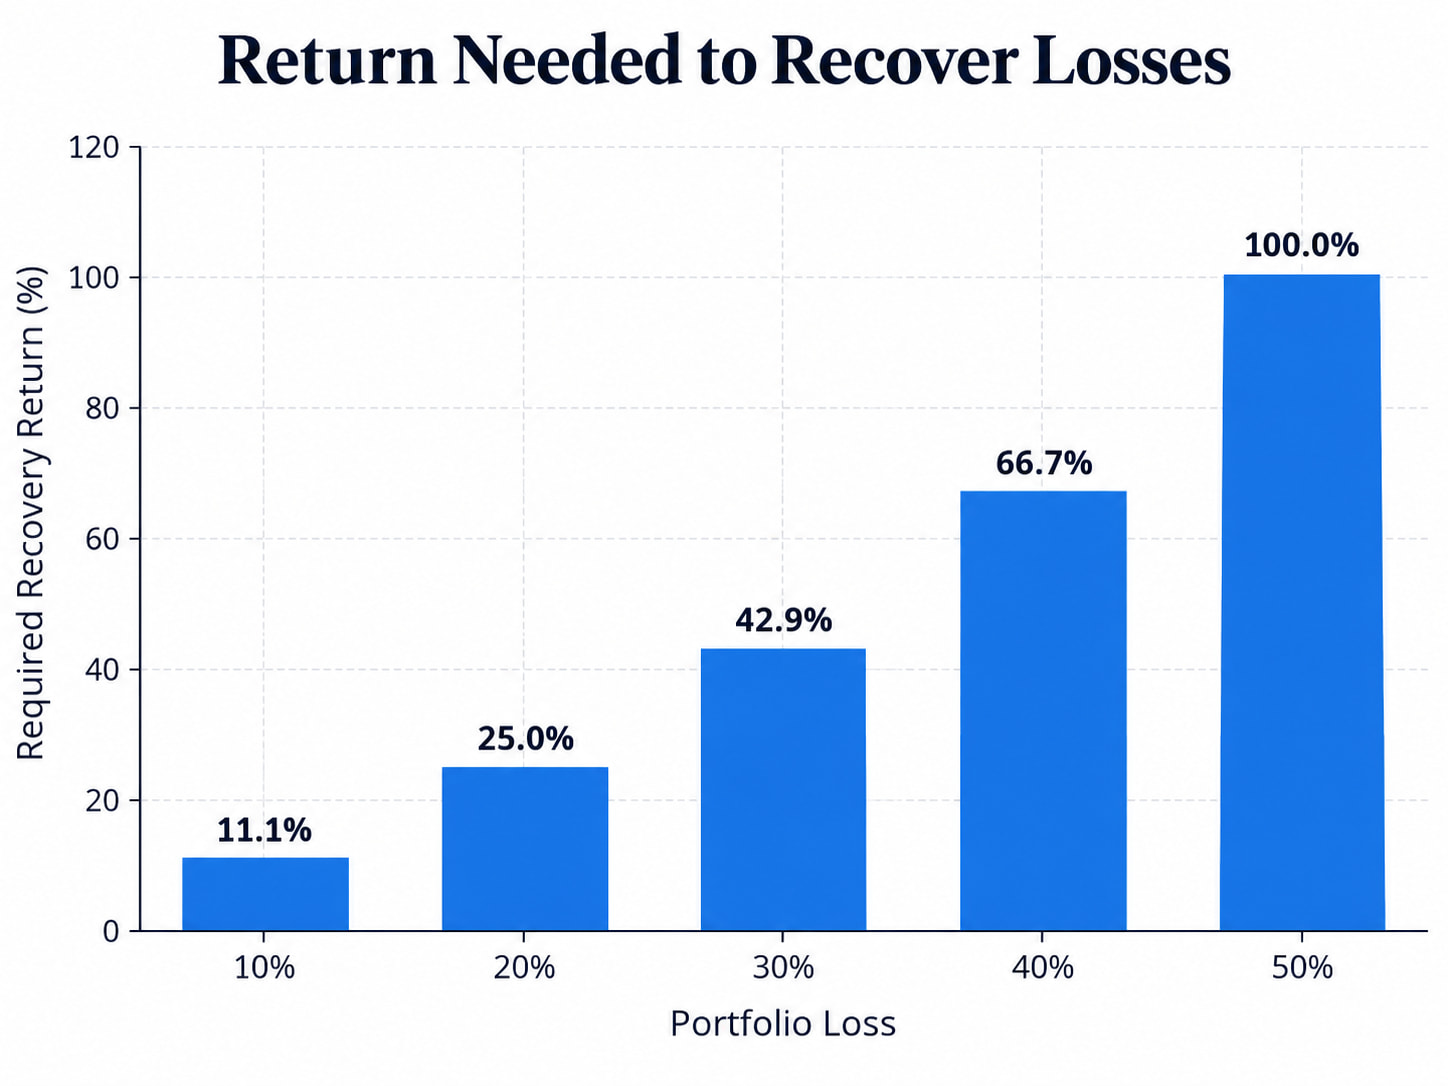
If your portfolio falls by 40%, you need a 66.7% return just to recover your losses.
However, if it falls by 15%, you need only a 17.6% return to recover.
Here’s how the mathematics works:
| Portfolio Loss | Return Needed to Recover |
|---|---|
| 10% | 11.1% |
| 20% | 25.0% |
| 30% | 42.9% |
| 40% | 66.7% |
| 50% | 100.0% |
This happens because losses and gains are mathematically asymmetric.
For example, if your ₹1 lakh portfolio declines by 50%, its value becomes ₹50,000.
To recover that loss, the portfolio needs to double in value, requiring a 100% return.
The deeper the drawdown, the greater the percentage gain required to recover.
This is one reason managing downside risk is such an important aspect of long-term investing.
Returns Don’t Tell the Entire Story
Imagine two strategies that deliver similar long-term returns.
One generates relatively consistent performance, while the other experiences frequent and significant fluctuations.
Even if both end up at approximately the same portfolio value, the experience of holding them can be very different.
This is why quantitative researchers examine several metrics beyond CAGR:
- Maximum Drawdown: The largest peak-to-trough decline in portfolio value.
- Sharpe Ratio: Measures excess returns relative to the strategy’s total volatility.
- Sortino Ratio: Similar to Sharpe, but focuses specifically on downside volatility.
- Calmar Ratio: Compares annualized returns with maximum drawdown.
Each metric provides a different perspective on a strategy’s performance.
For instance, a strategy generating 20% CAGR with relatively controlled drawdowns might be preferable for some investors to a strategy generating 25% CAGR with significantly greater risk.
However, no single metric can determine whether a strategy is good or bad.
Returns tell us how much a strategy has generated, while risk metrics help us understand the uncertainty and potential losses experienced along the way.
Risk Management Is Not About Avoiding Losses
An important distinction: risk management does not mean eliminating losses.
Every equity investing strategy can experience periods of underperformance.
Instead, risk management focuses on reducing the potential impact of individual losses, concentrated exposures, and adverse market conditions on the overall portfolio.
Some commonly used techniques include:
Diversification
Avoiding excessive dependence on a single stock, sector, or investment theme.
A diversified portfolio can help reduce company-specific and sector-specific risks, although it cannot eliminate broader market risk.
Position Sizing
Controlling how much capital is allocated to individual positions.
Even a strong investment idea can expose a portfolio to significant risk if too much capital is concentrated in a single stock.
Portfolio Rebalancing
Periodically adjusting portfolio allocations to maintain the intended investment exposure.
Rebalancing can help prevent portfolio weights from drifting too far away from their intended levels.
Volatility-Based Allocation
Adjusting position sizes or portfolio exposure based on prevailing volatility.
Some systematic strategies use volatility measures to determine how much risk to allocate to individual positions or the overall portfolio.
Regime-Aware Risk Management
Evaluating whether changing market conditions warrant adjustments to portfolio exposure.
For example, a systematic strategy might use predefined indicators to identify periods of elevated market risk and adjust its allocations accordingly.
Each of these techniques comes with trade-offs.
Defensive allocations may reduce drawdowns during market declines, but they can also limit participation in strong market recoveries.
Similarly, frequent rebalancing may help maintain portfolio exposure but can increase transaction costs.
The objective is not to maximize performance in every market environment, but to manage risk across different environments.
The Real Challenge: Staying Invested
A strategy can look excellent on paper and still be difficult for an investor to follow.
Imagine investing ₹10 lakh in a strategy.
Over the next few months, your portfolio declines to ₹6 lakh.
That’s a 40% drawdown.
Even if historical simulations suggest that the strategy may eventually recover, continuing to invest through such a decline can be psychologically challenging.
Investors may exit during periods of maximum uncertainty, potentially locking in losses and missing subsequent recoveries.
This highlights an important point:
A strategy’s theoretical long-term performance is useful only to the extent that an investor can realistically tolerate its risks and follow the investment plan.
The difference between a strategy’s historical returns and an investor’s actual experience can be substantial.
Risk management, therefore, isn’t just about portfolio mathematics.
It also helps make an investment strategy more sustainable from an investor’s perspective.
A strategy with an appropriate risk profile may be easier for an investor to remain committed to during difficult market conditions.
What Does This Mean for Systematic Investing?
In quantitative investing, historical performance is only one part of the evaluation process.
One of the biggest challenges in quantitative research is distinguishing between strategies that performed well because of a repeatable investment process and those that benefited from favourable historical conditions.
A strategy might demonstrate an impressive historical CAGR, but that alone doesn’t establish whether its performance is robust.
A thorough research process should investigate several questions:
- Performance Across Market Conditions: How does the strategy behave during bull markets, bear markets, and periods of high volatility?
- Return Concentration: Are returns generated consistently, or do they depend heavily on a small number of exceptional trades or periods?
- Parameter Sensitivity: Do small changes in strategy parameters significantly affect historical performance?
- Transaction Costs and Execution: How much do brokerage, taxes, slippage, and execution assumptions affect realized returns?
- Out-of-Sample Performance: Does the strategy continue to perform reasonably on historical data that wasn’t used during its development?
These checks help evaluate whether a strategy’s historical results are supported by a potentially repeatable investment process rather than favourable historical circumstances or overfitting.
For example, a strategy that performs exceptionally well only with one very specific combination of parameters may be less robust than a strategy that delivers reasonably consistent results across a broader range of settings.
Similarly, a strategy that looks attractive before transaction costs may become significantly less appealing after incorporating realistic execution assumptions.
A great-looking backtest does not automatically translate into a robust investment strategy.
Even extensive validation cannot guarantee future performance, but it can help identify potential weaknesses before capital is deployed.
Ultimately, evaluating systematic strategies requires looking beyond the historical equity curve and understanding the risks, assumptions, and limitations behind the results.
Final Thoughts
Higher returns will always be attractive.
But when evaluating an investment strategy, it’s worth looking beyond the CAGR.
Drawdowns, volatility, diversification, consistency, and the ability to remain invested all play an important role in long-term investing outcomes.
The best investment strategy isn’t necessarily the one that delivers the highest returns on paper. It’s one that balances return potential with risks an investor can understand and sustain.
After all, successful investing isn’t just about how much your portfolio grows during favourable markets.
It’s also about how effectively risk is managed when markets move against you.
What Would You Choose?
Let’s return to our original example:
Strategy A: 25% CAGR with a 40% maximum drawdown.
Strategy B: 18% CAGR with a 15% maximum drawdown.
Which would you prefer for your portfolio, and why?
Would love to hear your perspective!
Disclaimer: All strategies, returns, and examples discussed are hypothetical and provided solely for educational purposes. Historical or simulated performance does not guarantee future results. This article does not constitute investment advice.